Prometheus
- justin antony
- Jan 25, 2024
- 8 min read
Updated: Feb 8, 2024
In the dynamic realm of DevOps, understanding and harnessing the capabilities of tools like Prometheus is pivotal.
Many may contradict with monitoring and observability when we discuss about Prometheus hence it is important to understand the differences and features which it brings.
We all know its not just planning & architecting the solution based on the customer requirements its even about how we sustain those objectives while operating the platform. Hence in these dynamic landscape, the need for effective system management and performance optimization is paramount. When something goes wrong with an application, it impacts customers and, ultimately, impacts the business. Teams need a way to find the root cause of problems and quickly resolve them. That’s where monitoring and observability come in. Monitoring tells you when something is wrong, while observability can tell you what’s happening, why it’s happening and how to fix it.
Monitoring in traditional way of collecting and analyzing data about a system’s performance, capacity, utilization, availability, and other relevant metrics. It focuses on tracking predetermined indicators and generating alerts when those indicators fall outside expected ranges or threshold. Nowadays especially for application we have option to define custom metric or super metric for the objects and in similar note we use Synthetic monitoring to simulate the behaviors and predict the situation. So Monitoring has grown much bigger and wider covering different aspect of the requirements however its different from what we call as Observability.
Kubernetes has several components designed to collect metrics, but two are essential in this case:
The kubelet collects metrics such as CPU and memory from your Pods.
The metric server collects and aggregates metrics from all kubelets. ( Command - Kubectl top pods)
Inspecting the kubelet for metrics isn't convenient — particularly if you run clusters with thousands of nodes. When you want to know the memory and CPU usage for your pod, you should retrieve the data from the metric server.
Not all clusters come with metrics server enabled by default. For example, EKS (the managed Kubernetes offering from Amazon Web Services) does not come with a metrics server installed by default.
Above solution doesn't meet new requirement or wont solve new era problems. Lets see how that can be tackled.
Observability solution analyzes output data, provides an assessment of the system’s health and offers actionable insights for addressing the problem. An observable system is one where DevOps team can see the entire IT environment with context and understanding of interdependencies.
Observability and application performance monitoring (APM) are often used interchangeably; however, it’s more accurate to view observability as an evolution of APM. APM tools typically focus on infrastructure monitoring, application dependencies, business transactions and user experience. These monitoring systems aim to quickly identify, isolate and solve performance problems
When it comes to monitoring vs. observability, the difference hinges upon identifying the problems you know will happen and having a way to anticipate the problems that might happen. At its most basic, monitoring is reactive, and observability is proactive. Both use the same type of telemetry data, known as the three pillars of observability.
The three pillars of observability are as follows:
Logs: A record of what’s happening within your software.
Metrics: A numerical assessment of application performance and resource utilization.
Traces: How operations move throughout a system, from one node to another.
Observability platforms also use telemetry, but in a proactive way. They automatically discover new sources of telemetry that might emerge within the system, such as a new API call to another software application. To manage and quickly gather insights from such a large volume of data, many platforms include machine learning and AIOps (Artificial Intelligence for Operations) capabilities that can separate the real problems from unrelated issues.
From observability point, what business looks for is to
Understand all application inter-dependencies to diagnose issues and determine impact.
Gain full observability in dynamic environments with auto-discovery. Be able to trace every request, record all changes and get one-second granularity metrics.
Proactively detect and remediate issues with an understanding of contributing factors. Analyze every user request from any perspective to quickly find and resolve every bottleneck
Automate discovery of application, infrastructure and services. Observability automation is simply an extension of existing automation within the CI/CD pipeline, further freeing up DevOps to focus on core tasks
Prometheus is an open-source monitoring and alerting system written in Golang, capable of collecting and processing metrics from various targets. You can also query, view, analyze the metrics and get alerted based on the thresholds
Architecture of Prometheus
Key Components of the architecture include:
Prometheus Server: The central element responsible for collecting and storing time-series data. It also evaluates rules and triggers alerts based on predefined conditions. So if we summarize, server collects and stores metrics, evaluates rules, and triggers alerts. The Prometheus server is the brain of the metric-based monitoring system.
Service Targets: These are endpoints of the services Prometheus monitors such as node, pod, application endpoints etc. The server scrapes metrics from these targets, facilitating real-time data collection. The general term for collecting metrics from the targets using Prometheus is called scraping. By default prometheus looks for metrics under /metrics path of the target. The default path can be changed in the target configuration.
Time-Series Database (TSDB): The metric data which prometheus receives changes over time (CPU, memory, network IO etc..). It is called time-series data. So Prometheus uses a Time Series Database (TSDB) to store all its data. By default Prometheus stores all its data in an efficient format (chunks) in the local disk. Overtime, it compacts all the old data to save space. It also has retention policy to get rid of old data. Prometheus also offers remote storage options. This is primarily required for storage scalability, long-term storage, backup & disaster recovery etc.
Push Gateway: Prometheus by default uses pull mechanism to scrap the metrics. However, there are scenarios where metrics need to be pushed to prometheus. In scenarios where the monitored services can't be scraped directly, the Push Gateway allows short-lived jobs to push their metrics to Prometheus. Pushgateway stores the metrics data temporarily in in-memory storage. It’s more of a temporary cache.
Exporters: From the target endpoints, prometheus expects data in certain text format. Each metric has to be on a new line. Usually these metrics (It could be system metrics like CPU, memory etc or Java JMX metrics, MySQL metrics etc.) are exposed on target nodes using prometheus exporters running on the targets. These are specific agents responsible for converting metrics from various third-party systems into a format that Prometheus can understand. For example, if you want to monitor a servers CPU and memory, you need to install a node exporter on that server and the node exporter exposes the CPU and memory metrics in the prometheus metrics format on /metrics. Once the Prometheus pulls the metrics, it will then combine the metric name, labels, value, and timestamp to give a structure to that data.
Service Discovery: In most autoscaling systems and distributed systems like Kubernetes, the target will not have a static endpoint. In this case, that target endpoints are discovered using prometheus service discovery and targets are added automatically to the prometheus configuration
Static configs: When the targets have a static IP or DNS endpoint, we can use those endpoints as targets.
Prometheus Alert Manager: Responsible for handling alerts generated by the Prometheus server. It deduplicates, groups, and routes alerts to various receivers, ensuring effective incident response. Its primary job is to send alerts based on metric thresholds set in the Prometheus alert configuration
Alert Deduplicating: Process of silencing duplicated alerts.
Grouping: Process of grouping related alerts together.
Silencing: Silence alerts for maintenance or false positives.
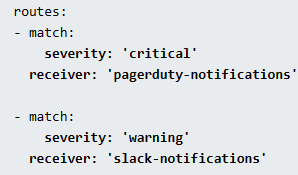
Routing: Routing alerts to appropriate receivers based on severities.
Inhibition: Process of stopping low severity alert when there is a medium of high severity alert.
Client Libraries: Prometheus provides client libraries in various languages, allowing developers to instrument their code for metric collection to expose metrics in the way Prometheus understands.
PromQL: PromQL, or Prometheus Query Language, is the query language used in Prometheus, an open-source monitoring and alerting toolkit designed for reliability and scalability in a containerized, microservices environment.
Key Features for the Prometheus
Multi-Dimensional Data Model: Prometheus adopts a powerful multi-dimensional data model, allowing users to identify metrics through a unique combination of key-value pairs. This flexibility enables granular and precise monitoring.
Powerful Query Language (PromQL): Prometheus introduces PromQL, a purpose-built query language that facilitates complex queries on the collected metrics. This language empowers users to gain deep insights into their systems.
Dynamic Service Discovery: Prometheus simplifies configuration through dynamic service discovery, automatically identifying and monitoring new services as they come online. This ensures that monitoring scales seamlessly with the infrastructure.
Time Series Collection: Prometheus excels in collecting and storing time-series data efficiently, enabling users to analyze historical trends and patterns.
In nutshell, The system follows a server-scraping model where Prometheus servers actively pull metrics from configured targets. This decentralized approach enables scalability and flexibility in monitoring diverse services
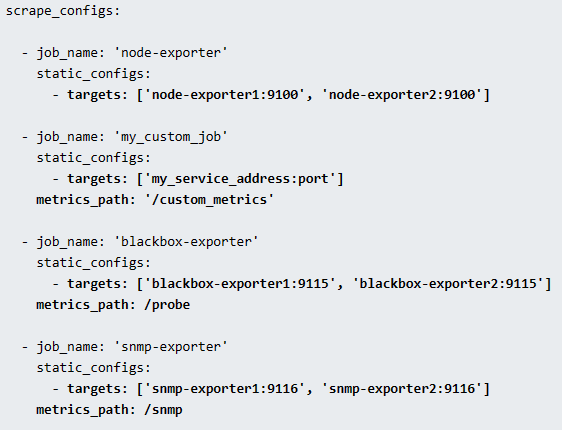
Prometheus periodically scrapes the metrics, based on the scrape interval that we mention in the Prometheus configuration file. Below example would give a better idea.

Target configurations are present under the scrape_configs in the Prometheus configuration file. Prometheus categorized the Exporters in various sections such as Databases, Hardware, Issue trackers and continuous integration, Messaging systems, Storage, Software exposing Prometheus metrics, Other third-party utilities, etc.
Here is an example configuration.
Small example of the Kubernetes service discovery block of the Prometheus configuration file using kubernetes_sd_configs

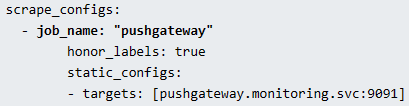
Pushgateway configuration also will be configured under the scrape_configs section in the Prometheus configuration.
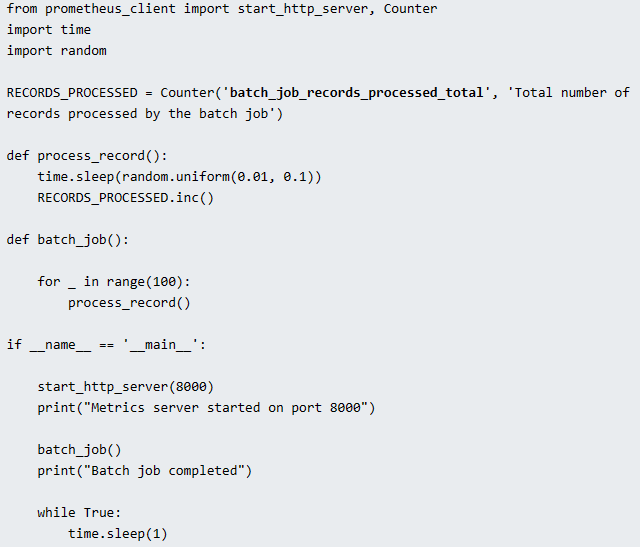
Here is an example Python Client Library that exposes custom metrics named batch_job_records_processed_total.
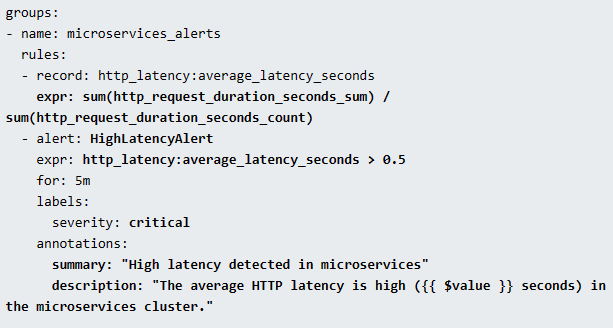
Here is an example configuration of an Prometheus alert rule
This is an example of the routing configuration of the Alertmanager configuration file
Kubernetes is the perfect example for dynamic targets. Here, you cannot use the static targets method, because targets (pods) in a Kubernetes cluster is ephemeral in nature and could be short lived. There is also File-Based Service Discovery file_sd_configs in Kubernetes. It is for static targets, but the main difference between the classic Static configuration static_configs and the file_sd_configs is that, in this, we create separate JSON or YAML files and keep our target information in them. Prometheus will read the files to identify the targets.
PromQL is used to retrieve and process time-series data collected by prometheus.
Basic Concepts:
Time Series: In Prometheus, data is organized as time series, representing metric values over time. Each time series is identified by a metric name and a set of key-value pairs called labels.
Metrics and Labels: Metrics are identified by a name, and labels add dimensions to these metrics. For example, http_requests_total{method="GET", status="200"} represents the total count of HTTP GET requests with a 200 status.
PromQL Queries:
Instant Vectors: Queries that return a set of time series for a specific point in time, often used for single-value metrics.
➡ Example: http_requests_total{job="web"}
Range Vectors: Queries that return a set of time series over a specified time range, suitable for analyzing trends and patterns.
➡ Example: rate(http_requests_total{job="web"}[5m])
Aggregation Functions:
➡ sum(): Sum of time series values.
➡ avg(): Average of time series values.
➡ min(), max(): Minimum and maximum values.
Filtering and Matching:
➡ ==, =~, !=: Equal, regex match, and not equal operators.
➡ Example: http_requests_total{status=~"5..", job="api"}
Mathematical Operations:
➡ +, -, *, /: Basic arithmetic operations.
➡ Example: http_requests_total{job="app"} / ignoring(status) group_left sum(http_requests_total{job="db"})
Advanced Features:
Alerting Rules: Defining rules to trigger alerts based on specified conditions in PromQL queries.
Recording Rules: Precompute frequently used queries to enhance performance and reduce load on the server.
⏲ Functions:
➡ rate(): Computes per-second rate of increase of a time series.
➡ irate(): Similar to rate(), but instantaneous rate at the last two data points.
PromQL is a powerful and flexible query language that plays a central role in extracting meaningful insights from the time-series data collected by prometheus. Whether you're monitoring system performance or debugging issues, mastering PromQL is essential for effective use of Prometheus.
Comments